Foram encontradas 120 questões.
Text II
Peak Oil for Dummies
by Tom Rogue - August 09, 2009
Over the past decade, a fierce debate has emerged amongst energy experts about whether global oil production was about to reach a peak, followed by an irreversible decline. This event, commonly known as “Peak Oil” far outreaches the sole discipline of geology. From transportation to modern agriculture, petrochemicals and even the pharmaceutical industry all of them rely on one commodity: cheap and abundant oil. In order to sustain the needs of an ever globalized world, oil demand should double by 2050.
Nonetheless, geological limitations will disrupt this improbable scenario. In fact, a growing proportion of energy experts argue that Peak Oil is impending and warn about the extraordinary scale of the crisis.
According to the 2009 BP Statistical Review, the world has precisely 42 years of oil left. Those numbers come from a very simple formula, the R/P ratio, which consists of dividing the official number of global oil reserves by the level of today’s production.
Nevertheless, this methodology is dangerously defective on several key points as it ignores geological realities. Oil production does not consist of a plan level of production that brutally ends one day; it follows a bell-shaped curve.
Indeed, the important day occurs when production starts to decline, not when it ends. As it is a non-flexible commodity, even a small deficit in oil production can lead to a major price surge.
Finally, the R/P ratio does not acknowledge that production costs increase over the time; the first oil fields to be developed were logically the easy ones and so the most profitable. It is well recognized that remaining oil fields consist of poor quality oil or remotely located fields which need high technologies and expensive investments. Therefore, relying on the R/P ratio gives a false impression of security while the actual situation is critical.
Oil is a strategic resource; therefore having oil is a key political and economical advantage for a state. This is why politics interfere in the evaluation of oil reserves, especially in countries with poor accountability records; that is, the majority of OPEC countries. In fact, OPEC oil reserves have dramatically increased during the 1980s and 1990s. However, they have not discovered major oil fields after the 1970s. At this conjuncture, the question of what lays behind these fluctuations needs to be asked.
The geologist Dr. Colin Campbell, founder of the Association for the Study of Peak Oil and Gas (ASPO), explains the hidden reasons that led to these changes: “In 1985, Kuwait, added 50% to its reserve. At that time, the OPEC quota was based on the reported reserves; the more you reported, the more you could produce.”
Fellow OPEC members who were unwilling to see the influence of Kuwait growing, simply raised their reserves soon after. Moreover, OPEC countries continue to present their reserves as flat despite having extracted huge amounts of oil during the past twenty years.
At this point, we should not forget that oil reserves reported by these countries are not audited by independent experts. In 2006, the notorious Petroleum Intelligence Weekly said it had access to confidential Kuwaiti reports which stated that reserves were half the official numbers.
The question of oil reserves is most relevant. As oil exporting countries have less oil in their ground, Peak Oil will arrive faster. Oil optimists who argue Peak Oil is still decades away rely on these same erroneous data.
In addition, if importing countries assume oil reserves are abundant as they do, the crisis will be unexpected, unprepared and misunderstood; in one word: overwhelming. Similarly, once oil shortages occur, oil importing countries may assume that exporting countries are deliberately reducing their oil exports to harm their national interests.
Such a flawed assumption from oil importing countries is likely to have serious repercussions, and eventually lead to new oil wars.
http://seekingalpha.com/article/154901-peak-oil-for-dummies, access on March 14, 2010.
The fragment “oil demand should double by 2050.” expresses a(n)
Provas
Questão presente nas seguintes provas
Text I
The age of speed: how to reduce global fuel consumption by 75 percent
September 11, 2008
Low-tech Magazine
Breaking speed records was an almost daily occurrence throughout the 20th century. Cars, ships, planes and trains became faster and faster, year after year. Because the power needed to push an object through air increases with the cube of velocity, this race to ever higher speeds raises energy consumption exponentially.
Engineers treat velocity as a non-variable, while in fact it is the most powerful factor to save a really huge amount of energy - with just one stroke, at minimal cost, and without the need for new technology. Lower speeds combined with more energy efficient engines, better aerodynamics and lighter materials could make fuel savings even larger.
Air resistance increases with the square of speed, and therefore the power needed to push an object through air increases with the cube of the velocity. If a car cruising on the highway at 80 km/h requires 30 kilowatts to overcome air drag, that same car will require 240 kilowatts at a speed of 160 km/h. Thus, a vehicle needs 8 times the engine power to reach twice the speed. In principle, this means that fuel consumption will increase fourfold (not eightfold, because the faster vehicle exerts the power only over half the time).
Over a distance of 1,000 kilometres, the slow car would consume 375 kilowatt-hours (12.5 hours multiplied by 30 kilowatts) and the fast car would consume 1,500 kilowatt-hours (6.25 hours multiplied by 240 kilowatts).
However, this extra fuel consumption can be diminished or even negated by, most importantly, more fuel efficient engines, lighter materials and better aerodynamics. Even though today’s cars are faster than those from decades ago, they consume a similar amount of fuel. This is the reason why almost everybody is talking about energy efficiency and aerodynamics, and not about speed.
But if you lower the speed, fuel consumption is decreased by the full 75 percent. More efficient technology cannot change that – unless in a positive way. If you combine a lower speed with more fuel efficient engines and better aerodynamics, fuel savings can become much larger than 75 percent.
A decrease of 75 percent in fuel consumption is not peanuts. More than 60 percent of world oil production is used for transportation, which means that total oil production would be almost halved (-45%). In combination with more efficient engines, better aerodynamics and lighter materials a 75 percent reduction of oil production is not unrealistic.
Yet, when the International Energy Agency argues that the average car sold in 2030 would need to consume 60 percent less fuel than the average car sold in 2005, it claims: “With current technologies, only plug-in hybrids are capable of this”.
This statement is wrong. We could lower the fuel consumption of cars (and other vehicles) by at least 75 percent, we could do it today, and we can do it with present technology.
© Kris De Decker (edited by Vincent Grosjean) http://www.lowtechmagazine.com/2008/09/speed-energy.html, access on April 6, 2010.
‘It’ in “... while in fact it is the most powerful factor...” refers to
Provas
Questão presente nas seguintes provas
Text II
Peak Oil for Dummies
by Tom Rogue - August 09, 2009
Over the past decade, a fierce debate has emerged amongst energy experts about whether global oil production was about to reach a peak, followed by an irreversible decline. This event, commonly known as “Peak Oil” far outreaches the sole discipline of geology. From transportation to modern agriculture, petrochemicals and even the pharmaceutical industry all of them rely on one commodity: cheap and abundant oil. In order to sustain the needs of an ever globalized world, oil demand should double by 2050.
Nonetheless, geological limitations will disrupt this improbable scenario. In fact, a growing proportion of energy experts argue that Peak Oil is impending and warn about the extraordinary scale of the crisis.
According to the 2009 BP Statistical Review, the world has precisely 42 years of oil left. Those numbers come from a very simple formula, the R/P ratio, which consists of dividing the official number of global oil reserves by the level of today’s production.
Nevertheless, this methodology is dangerously defective on several key points as it ignores geological realities. Oil production does not consist of a plan level of production that brutally ends one day; it follows a bell-shaped curve.
Indeed, the important day occurs when production starts to decline, not when it ends. As it is a non-flexible commodity, even a small deficit in oil production can lead to a major price surge.
Finally, the R/P ratio does not acknowledge that production costs increase over the time; the first oil fields to be developed were logically the easy ones and so the most profitable. It is well recognized that remaining oil fields consist of poor quality oil or remotely located fields which need high technologies and expensive investments. Therefore, relying on the R/P ratio gives a false impression of security while the actual situation is critical.
Oil is a strategic resource; therefore having oil is a key political and economical advantage for a state. This is why politics interfere in the evaluation of oil reserves, especially in countries with poor accountability records; that is, the majority of OPEC countries. In fact, OPEC oil reserves have dramatically increased during the 1980s and 1990s. However, they have not discovered major oil fields after the 1970s. At this conjuncture, the question of what lays behind these fluctuations needs to be asked.
The geologist Dr. Colin Campbell, founder of the Association for the Study of Peak Oil and Gas (ASPO), explains the hidden reasons that led to these changes: “In 1985, Kuwait, added 50% to its reserve. At that time, the OPEC quota was based on the reported reserves; the more you reported, the more you could produce.”
Fellow OPEC members who were unwilling to see the influence of Kuwait growing, simply raised their reserves soon after. Moreover, OPEC countries continue to present their reserves as flat despite having extracted huge amounts of oil during the past twenty years.
At this point, we should not forget that oil reserves reported by these countries are not audited by independent experts. In 2006, the notorious Petroleum Intelligence Weekly said it had access to confidential Kuwaiti reports which stated that reserves were half the official numbers.
The question of oil reserves is most relevant. As oil exporting countries have less oil in their ground, Peak Oil will arrive faster. Oil optimists who argue Peak Oil is still decades away rely on these same erroneous data.
In addition, if importing countries assume oil reserves are abundant as they do, the crisis will be unexpected, unprepared and misunderstood; in one word: overwhelming. Similarly, once oil shortages occur, oil importing countries may assume that exporting countries are deliberately reducing their oil exports to harm their national interests.
Such a flawed assumption from oil importing countries is likely to have serious repercussions, and eventually lead to new oil wars.
http://seekingalpha.com/article/154901-peak-oil-for-dummies, access on March 14, 2010.
The aim of Text II is to
Provas
Questão presente nas seguintes provas
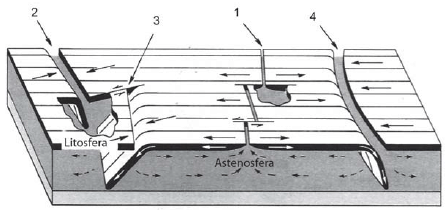
DAVIS, G.H. & REYNOLDS, S.J. 1996. Structural Geology of Rocks and Regions (second edition). John Wiley & Sons.
Considerando-se a figura acima, qual a ordem correta dos diferentes limites (1, 2, 3 e 4) entre as placas litosféricas?
| 1 | 2 | 3 | 4 |
Provas
Questão presente nas seguintes provas
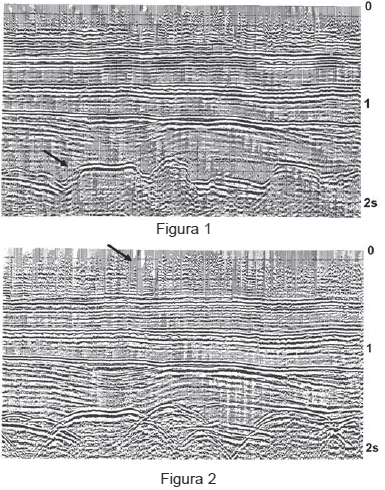
KEAREY, P., BROOKS, M., HILL,I, An Introduction to Geophysical
Exploration, Third Edition, Blackwell Science
Sobre as seções sísmicas mostradas nas Figuras 1 e 2, pode-se afirmar:
I - Interpretando-se a Figura 1, nota-se que o regime de sedimentação não varia com a profundidade, apesar das variações do refletor apontado pela seta indicarem o contrário. Tais variações, que podem ocasionar uma interpretação inicialmente errônea, são causadas por velocidades menores nas camadas acima dessas estruturas, provocando distorções no tempo.
II - Comparando-se as Figuras 1 e 2, conclui-se que se realizou um processamento sísmico na seção da Figura 1 para se obter a seção da Figura 2.
III - Na Figura 1, o processo de migração sísmica em tempo foi utilizado para colapsar as difrações que aparecem na seção da Figura 2.
IV - As descontinuidades dos dados mostrados no início da seção da Figura 2, exemplificadas pela seta, podem ser causadas pelo silenciamento dos maiores afastamentos, após a correção de NMO.
É(São) correta(s) APENAS a(s) afirmativa(s)
Provas
Questão presente nas seguintes provas
A transformada inversa de Fourier de !$ X(Ω)=\pi \delta(Ω+3 \pi)+ \pi \delta (Ω-3 \pi)-2 \pi \delta(Ω+7 \pi) !$é
Provas
Questão presente nas seguintes provas
Um corpo de massa m desloca-se horizontalmente regido pela equação diferencial !$ m {\large{dv(t) \over dt}}=kv(t) !$, onde t é instante genérico,v(t) é sua velocidade escalar e k é uma constante. Se esse corpo em t = 0 movimentava-se com velocidade v0, então v(t) será dado por
Provas
Questão presente nas seguintes provas
O cálculo da integral !$ ∫\large{tdt \over \sqrt{t+1}} !$ resulta em
Provas
Questão presente nas seguintes provas
A aproximação da expressão !$ f(x)-\ell n(1+x) !$, por um polinômio de Taylor de segundo grau em x = 0, é dada por
Provas
Questão presente nas seguintes provas
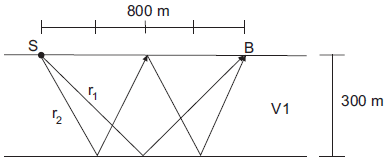
O sinal originário do ponto S é expresso pela equação !$ S=\cos(2000 \pi t+d)+ i \sin(2000 \pi t+d) !$ , onde d é a distância percorrida e t o tempo. Os sinais associados aos raios r1 e r2 são aprisionados entre as interfaces paralelas percorrendo os diferentes caminhos mostrados na figura acima. Considere que não há efeitos dissipativos ou inversão de polaridade nas reflexões e que é desprezível o efeito da divergência esférica. Sabendo-se que a distância entre as interfaces paralelas é igual a 300 m e a distância !$ \overline{SB}=800 !$ m, logo a expressão para o sinal resultante na posição B é
Provas
Questão presente nas seguintes provas
Cadernos
Caderno Container